 Kamari
Logs, audit trail and metrics
Kamari records what each plugin did, who asked for it and how long it took. You read it on the dashboard's Observe page, or ask for it through MCP tools.
Every plugin's log lines in one place
- Each line records a timestamp, the plugin, a level (DEBUG to CRITICAL) and the message.
- Output a plugin prints, rather than logs, is kept too. It is filed under that plugin when its own worker printed it, otherwise under
stdoutorstderr. - The Plugin Logs panel shows the latest 600 lines, filtered by plugin, level and time window.
- Secrets are replaced with
[REDACTED]as each line is stored, so the panel shows the redacted copy. - Kamari also writes its own console output to a file in its data folder, with secrets removed. The file rotates at 20 MiB, and the newest 5 files are kept.
Example of one log entry, as the logs_query tool returns it:
{"timestamp": "2026-10-16T09:12:03.481207+00:00",
 "plugin_id": "plugin.metrics",
 "level": "INFO",
 "message": "[plugin.metrics] capability metrics.record ok (3.2ms)"}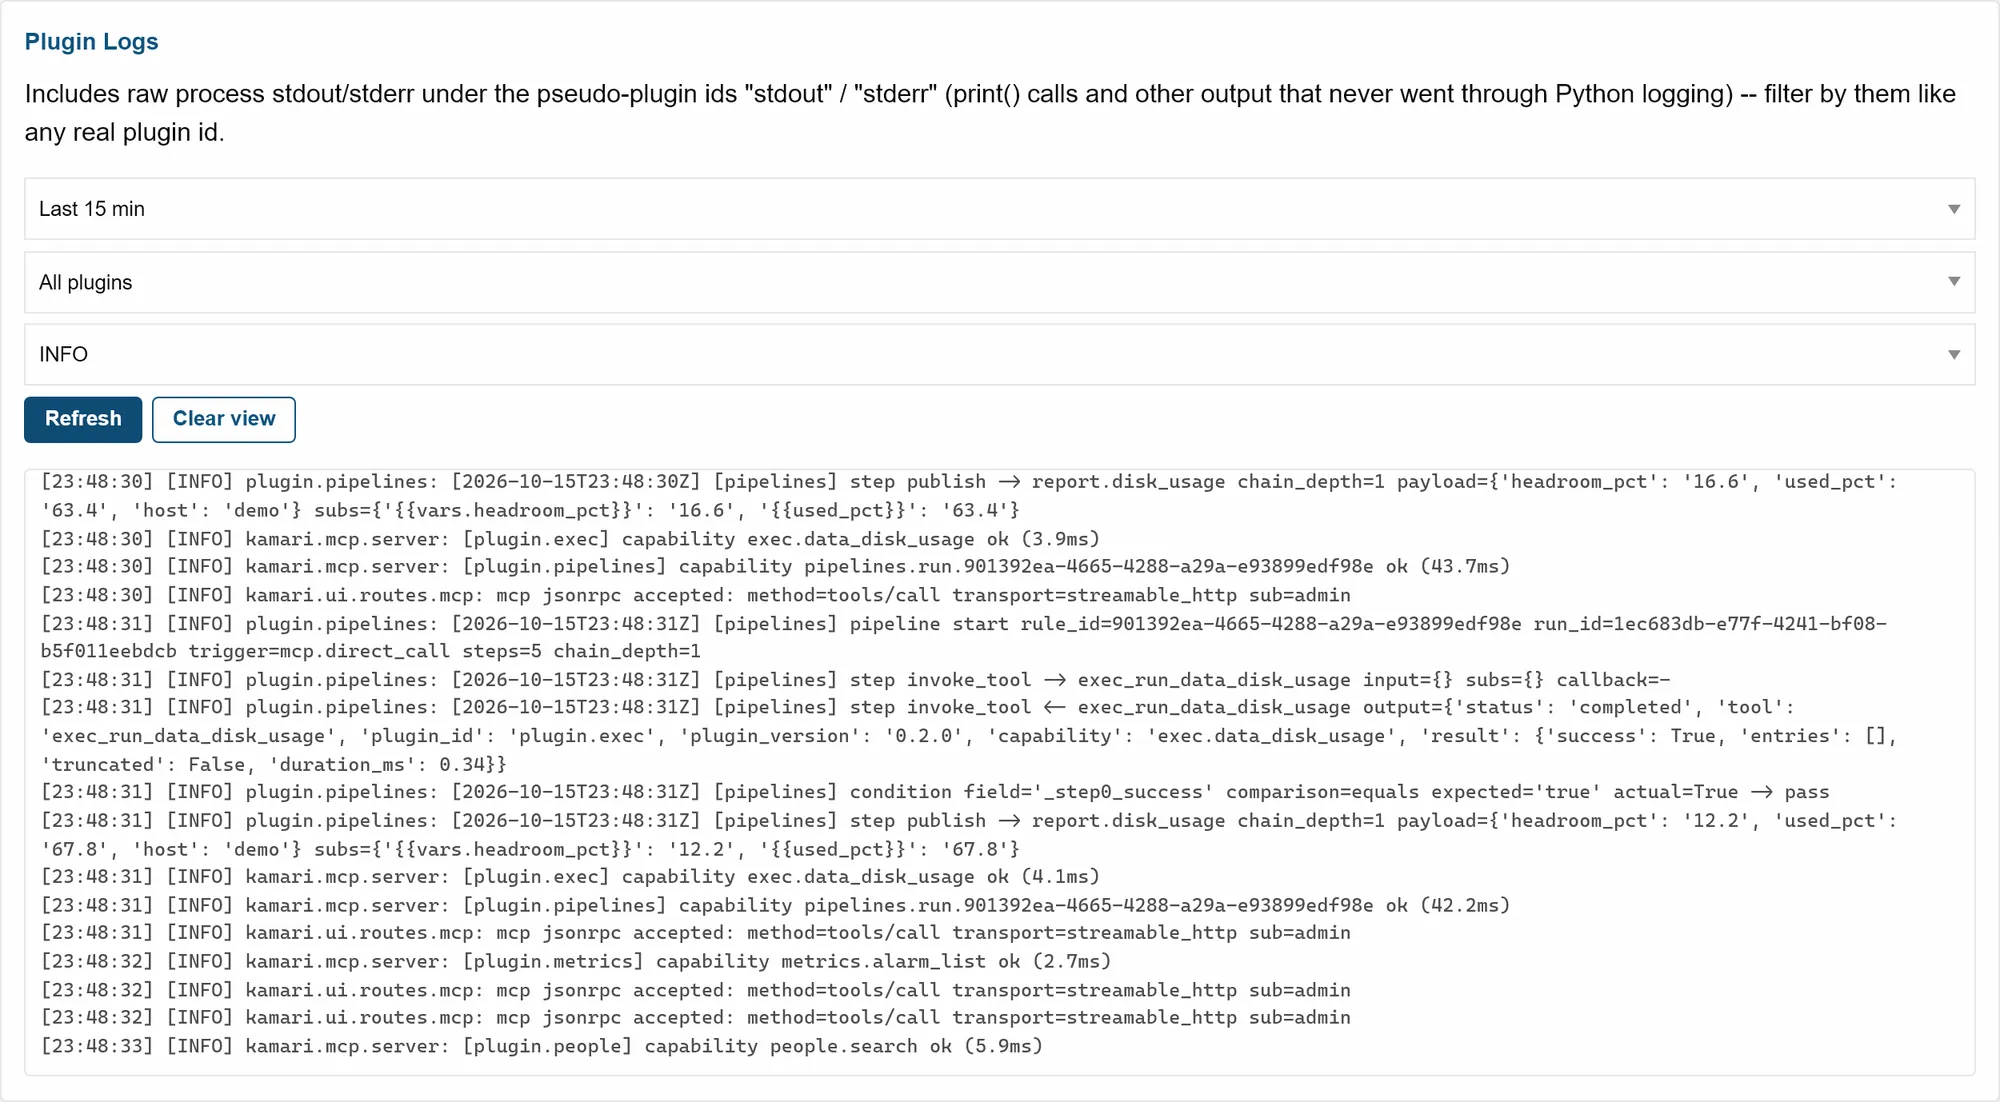
AI clients read logs with secrets removed
logs_queryreturns up to 1,000 lines, filtered by time, level, plugin or text.logs_summarize_sincegroups warnings and errors by pattern and counts them. It remembers where each caller stopped reading.- Both tools replace secrets with
[REDACTED]before you see them. That covers bearer tokens, API keys, passwords, cookies, AWS keys and vault references.
The audit log records who did what
- Every tool call is recorded with the caller and the outcome: allowed, denied (and why), or failed.
- Every capability run is recorded with its duration.
- Authentication checks are recorded with the user, the path and the source IP address.
- Every web request or DNS lookup a plugin makes goes through one gateway and is recorded. Only the host and path are kept; query strings and passwords in addresses are dropped.
- On the dashboard you filter by user, IP address, action and outcome.
Example of one audit record:
{"timestamp": "2026-10-16T09:12:03.402911+00:00",
 "actor": "alice",
 "action": "mcp.tool.invoke",
 "outcome": "allow",
 "details": {"tool_name": "metrics_record",
             "target_plugin": "plugin.metrics",
             "capability": "metrics.record"}}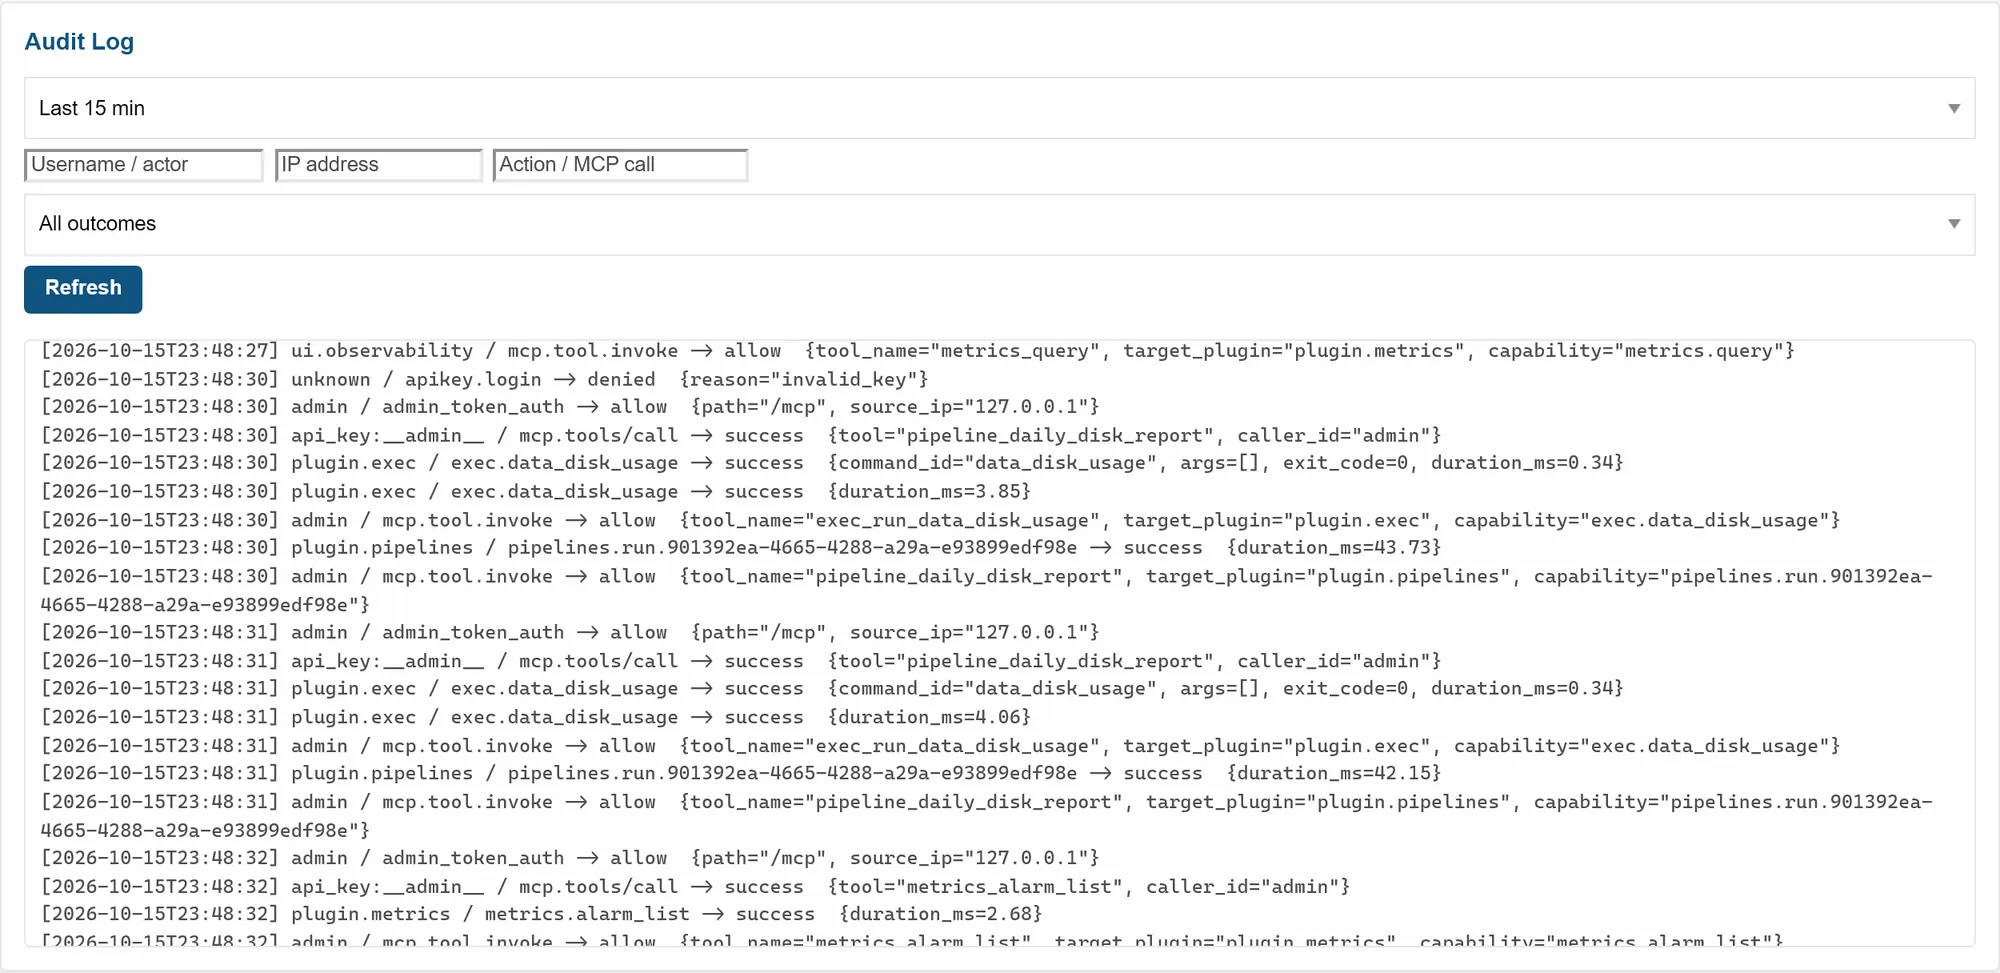
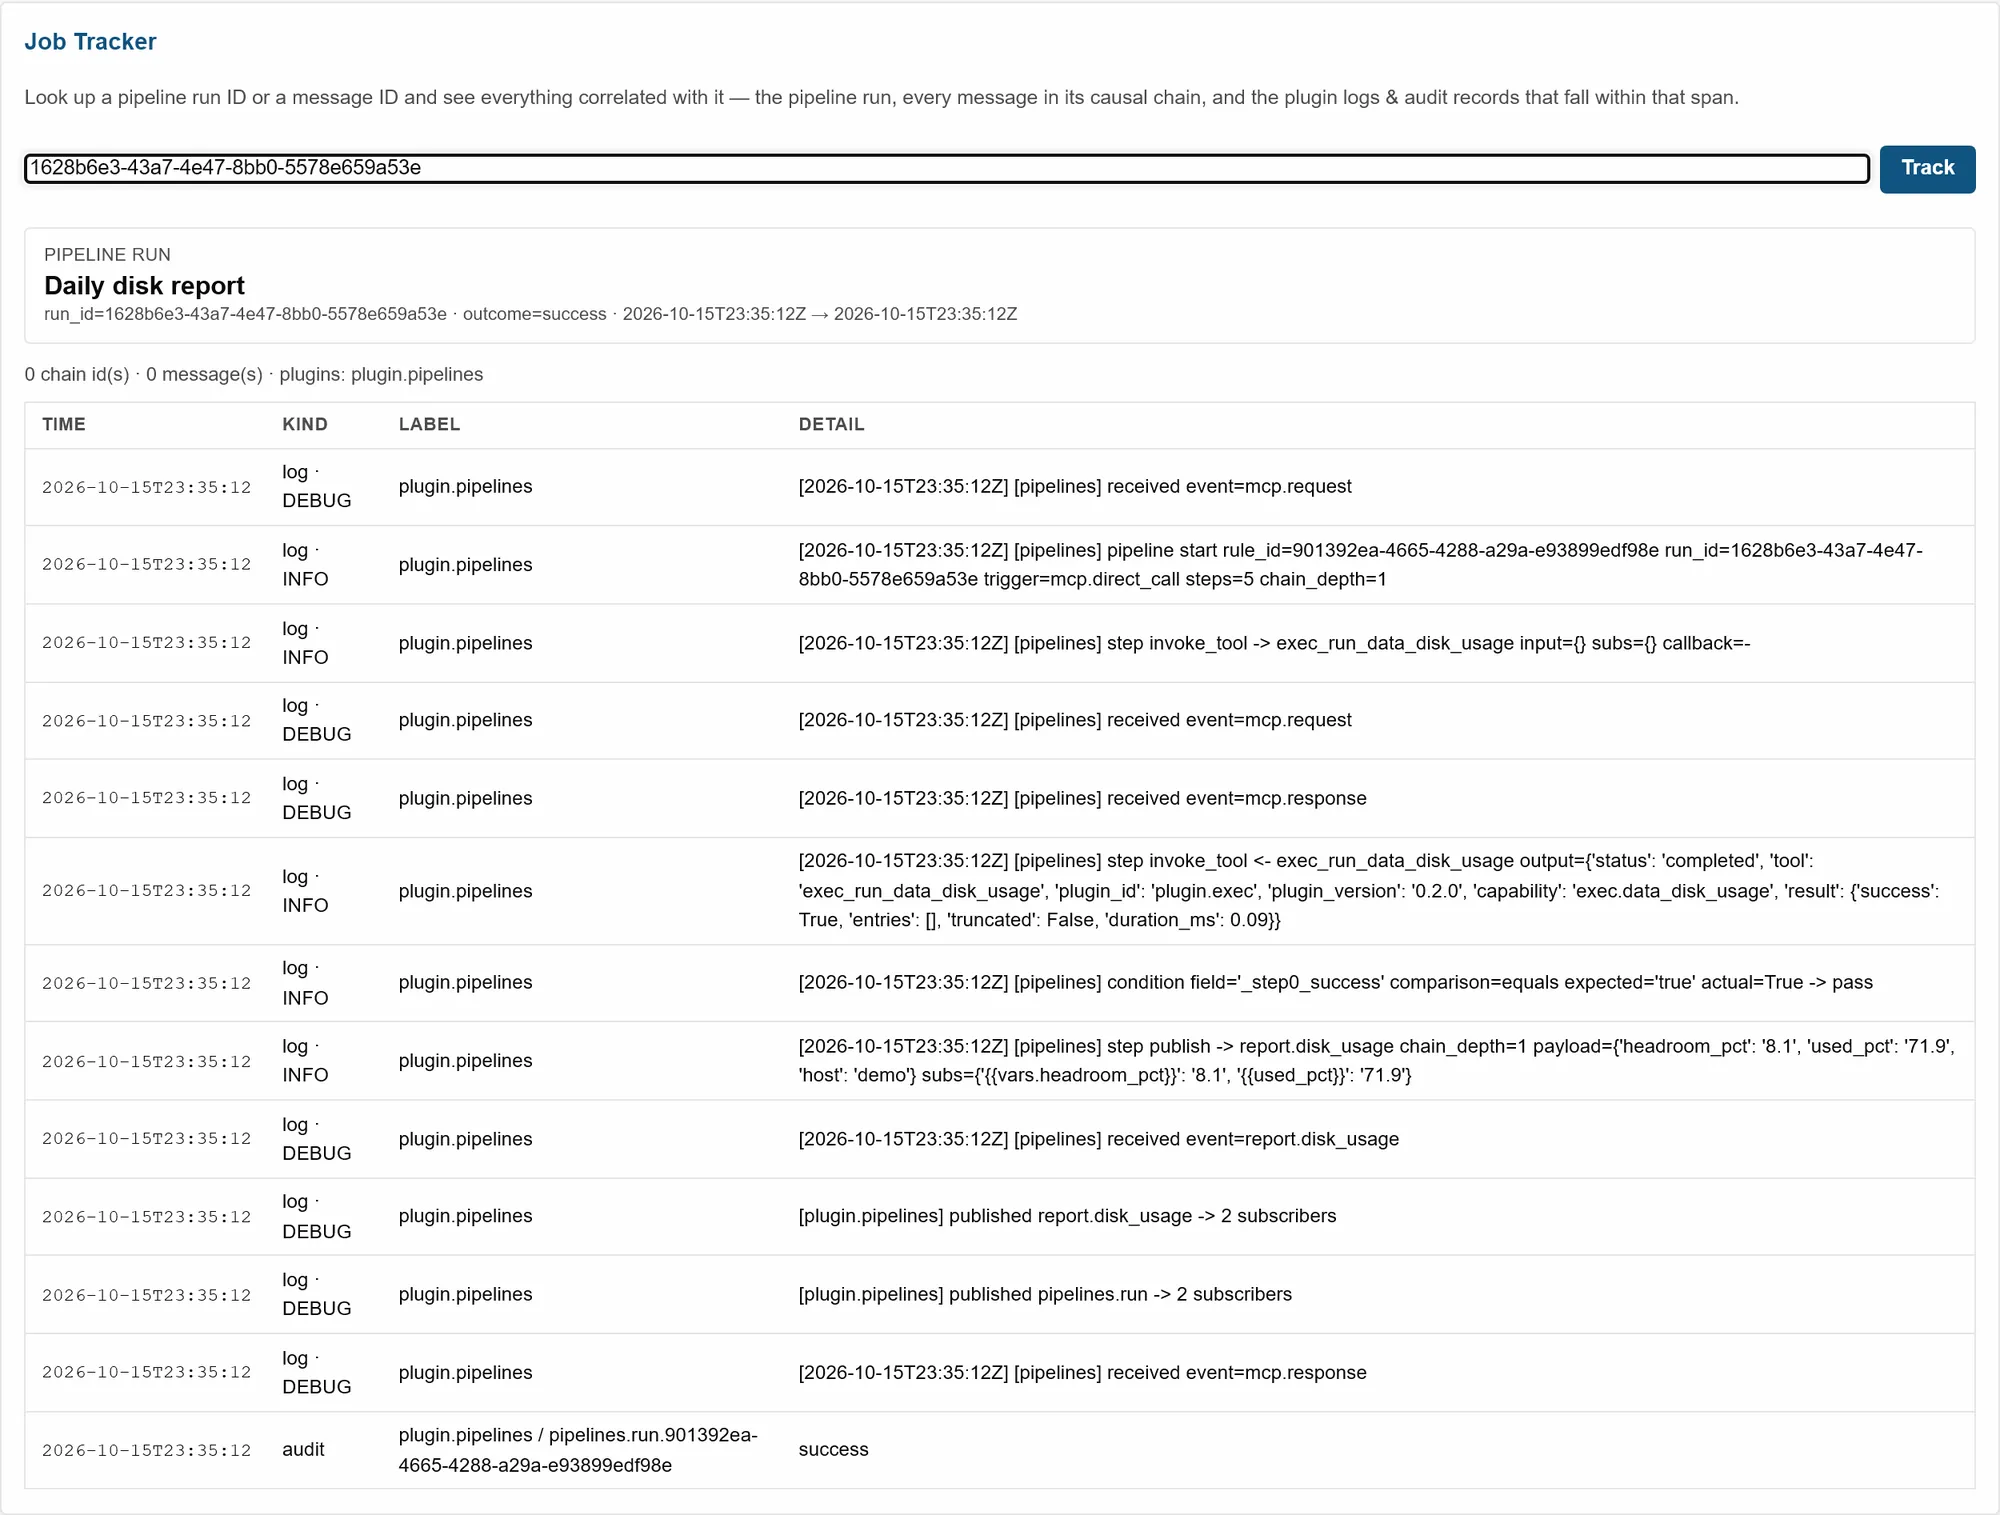
Trace one job from trigger to result
- Every message carries an ID and the list of messages that led to it.
- Paste a pipeline run ID or a message ID into the Job Tracker. It shows the run, then one timeline of the log lines and audit records of the plugins involved at that time, and the messages it can link to the job.
Every tool call is timed
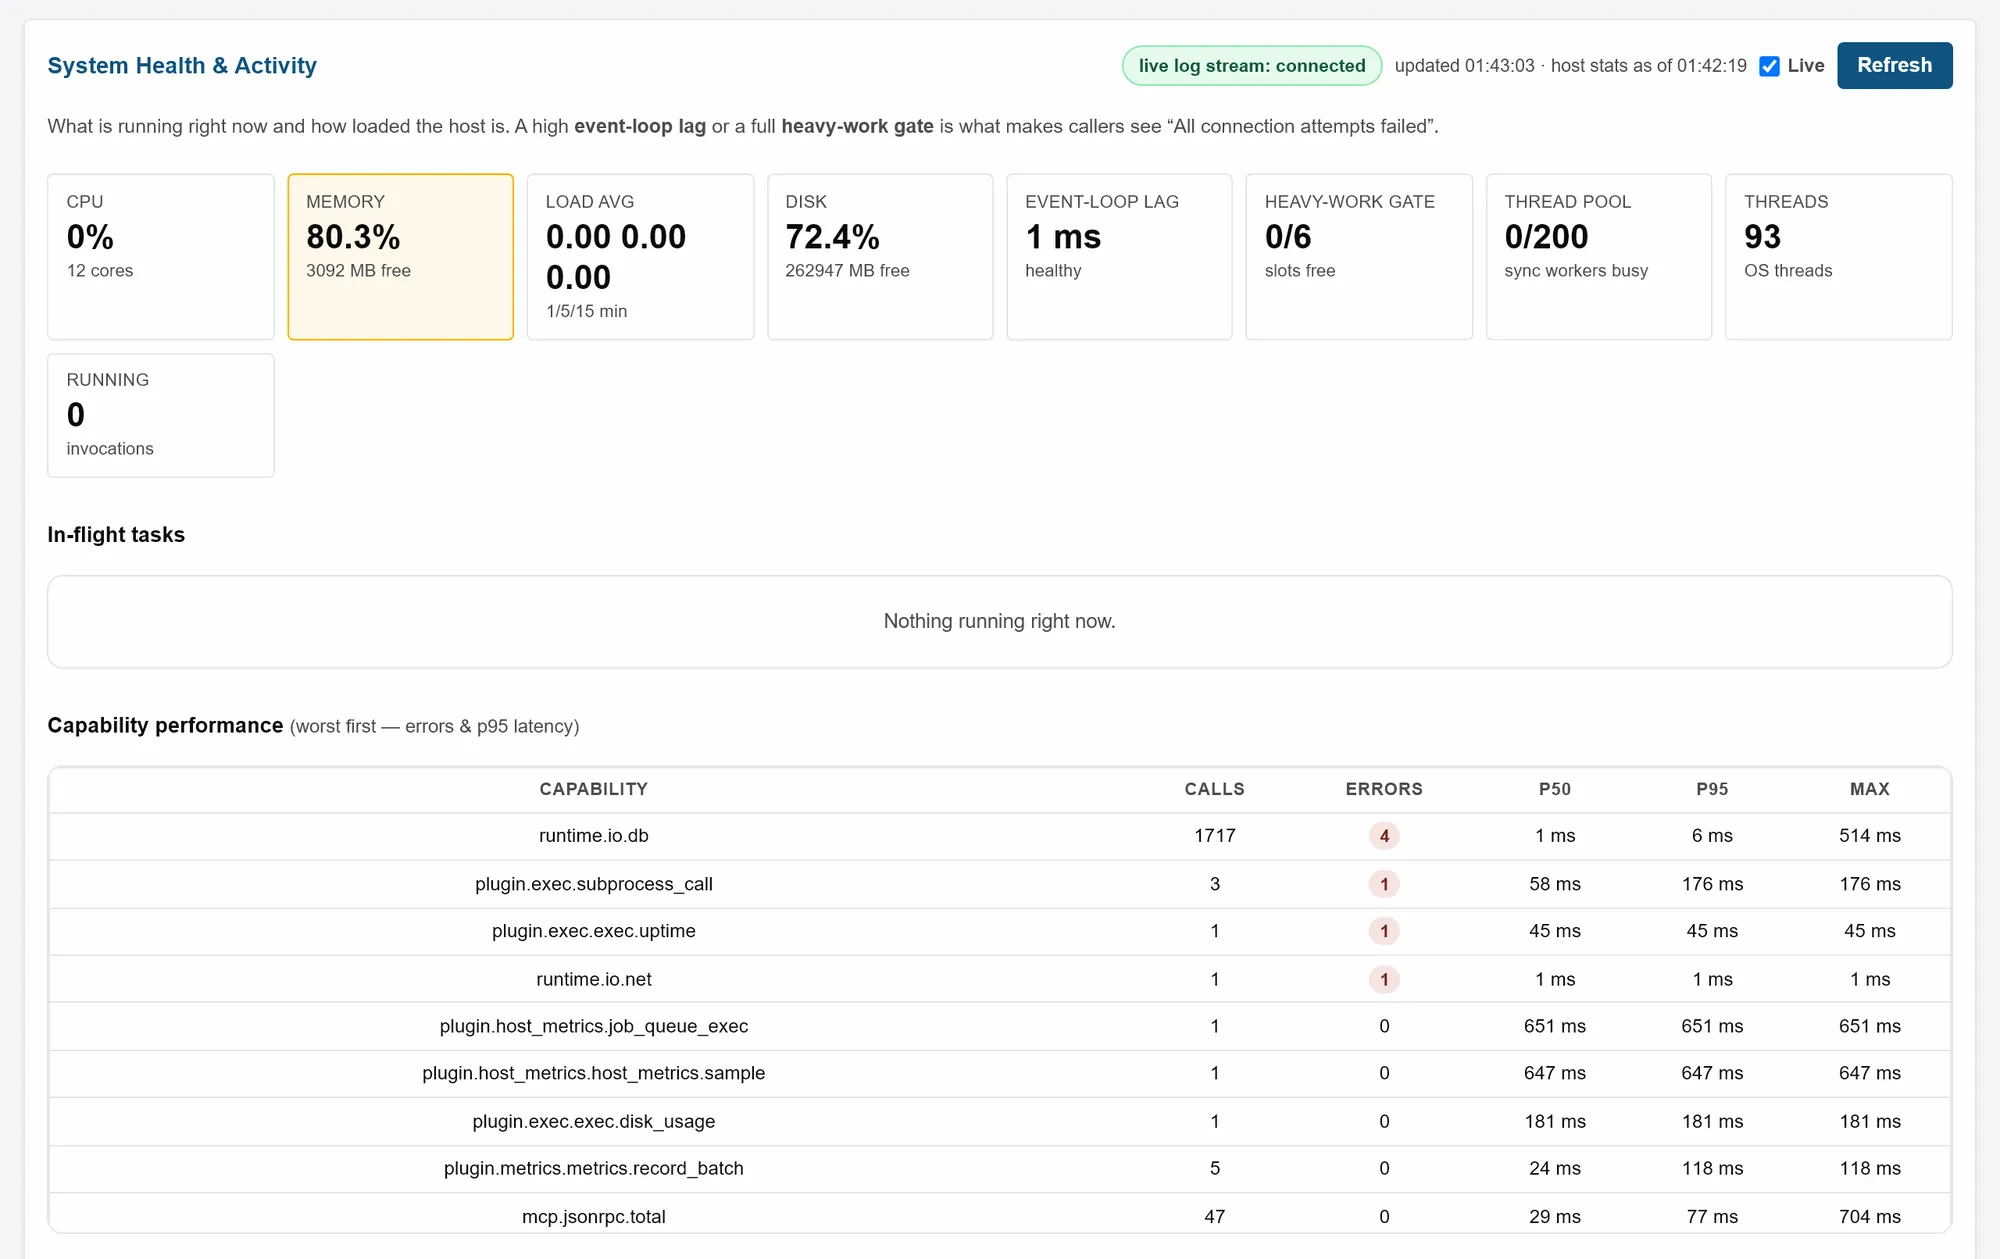
- Each capability records its duration, successes and errors, with no code in the plugin. Time spent waiting in a plugin's queue is measured separately.
- Every authenticated reply from the MCP endpoint carries a
Server-Timingheader that splits the time into phases. - The Observe page shows CPU, memory, disk, event-loop lag, running tasks and the slowest capabilities.
Record your own metrics and set alarms
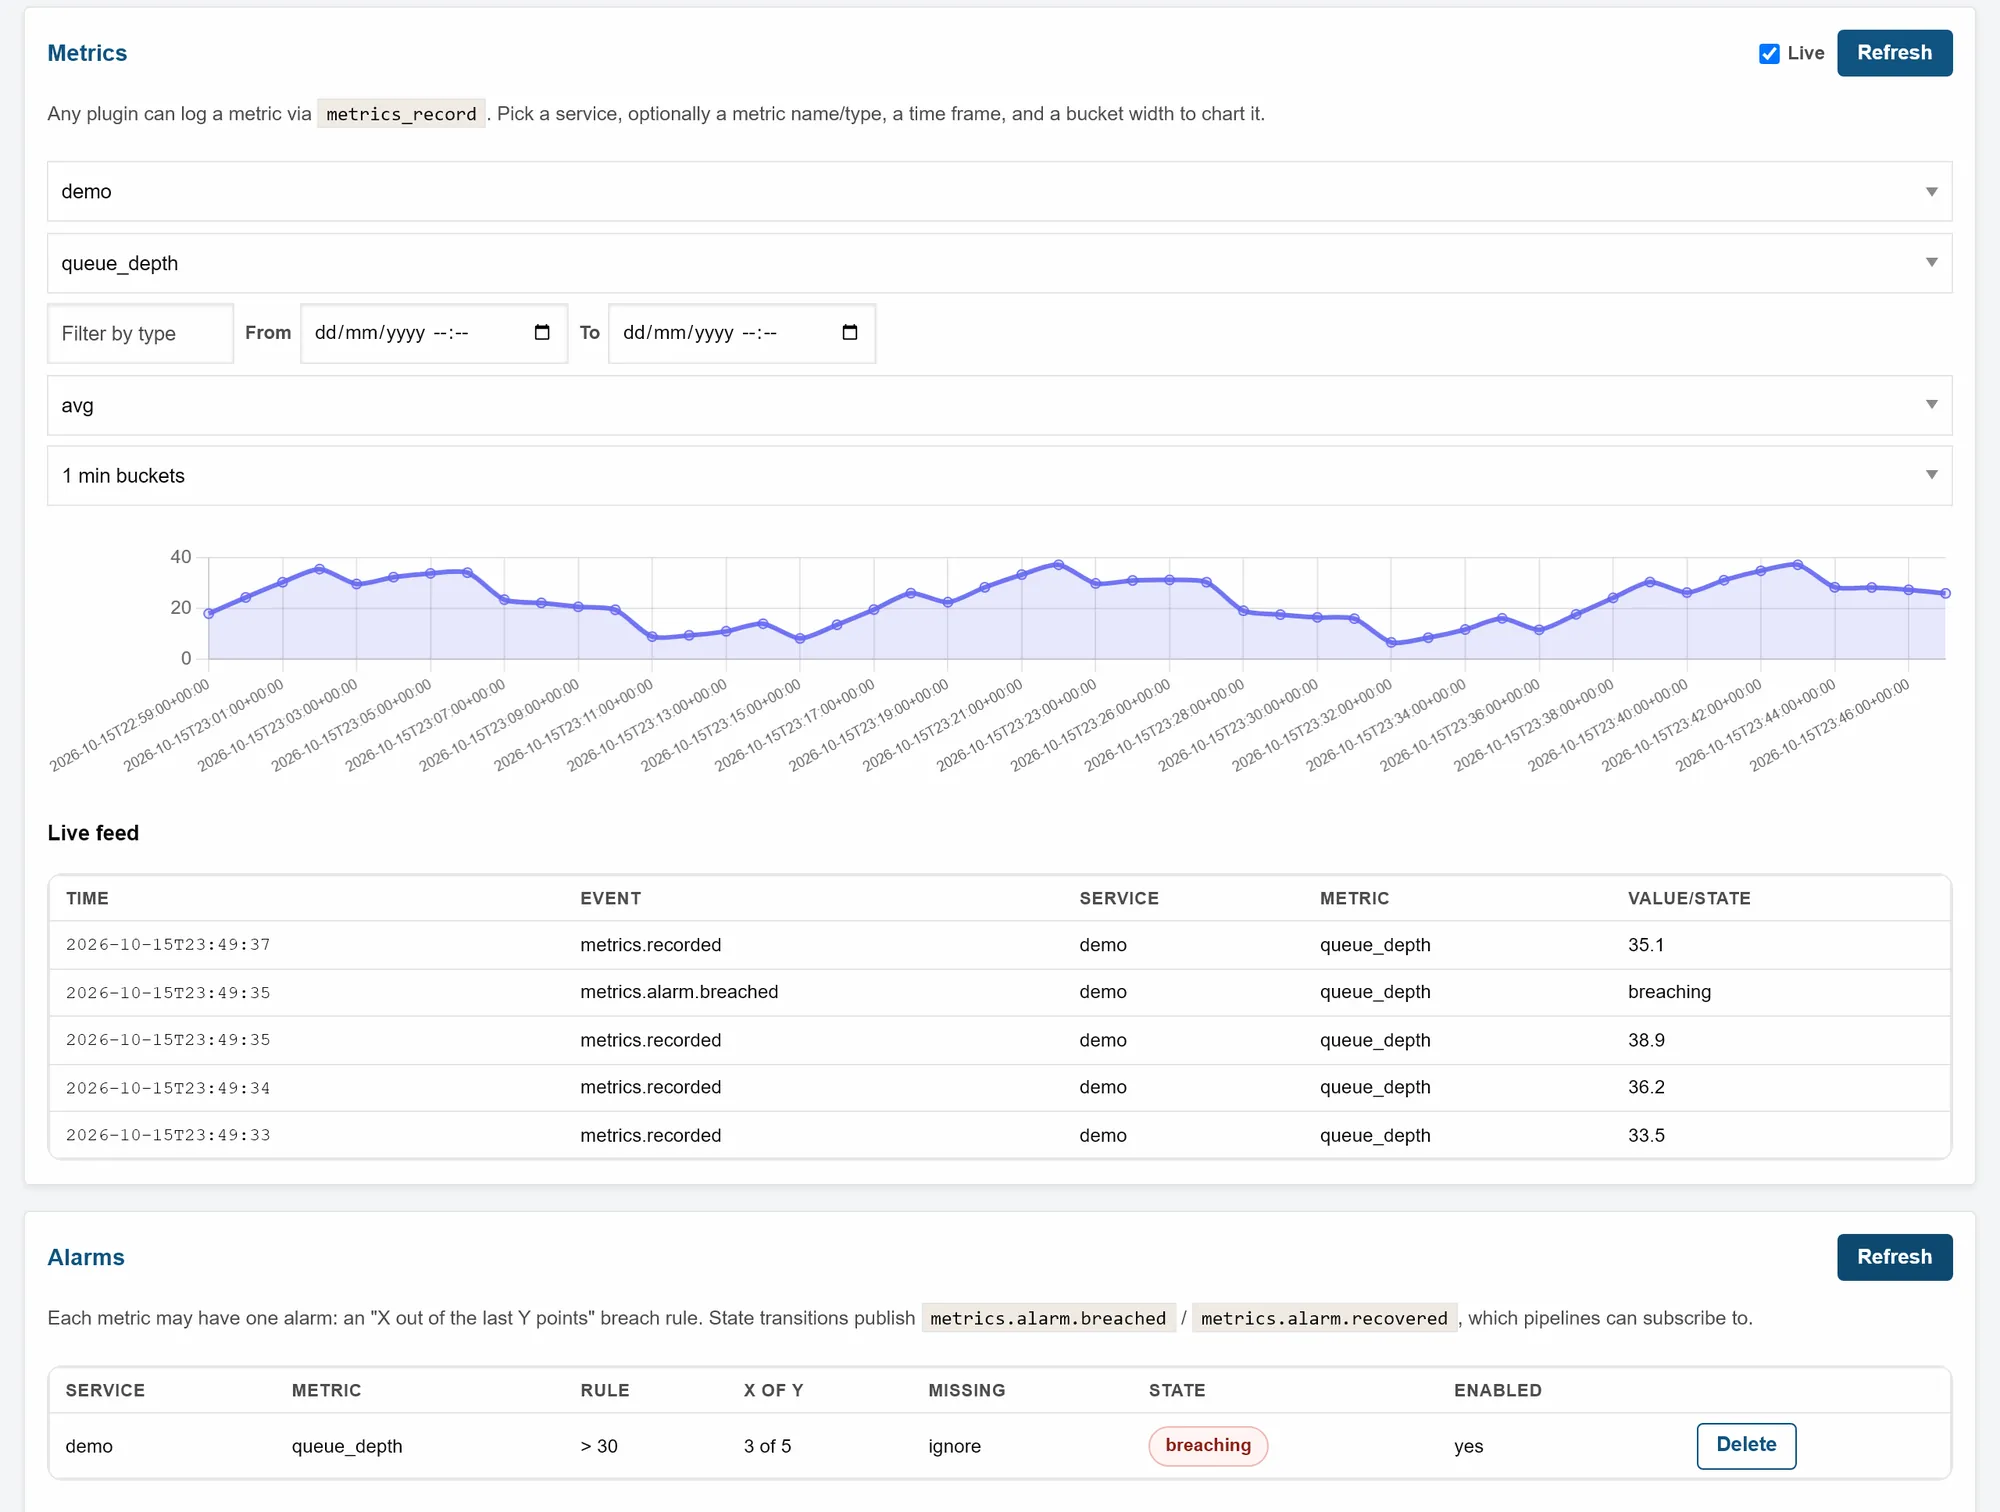
metrics_recordstores a value under a service and metric name. You chart it, or query count, sum, min, max or average per time bucket.- An alarm fires when X of the last Y values break a threshold. It raises
metrics.alarm.breachedand latermetrics.alarm.recovered, which a pipeline can act on. - The Host Metrics plugin samples CPU, memory and disk whenever a scheduled pipeline runs it, including disk use per plugin.
- Old values can be rolled up into hourly buckets with min, max, average, count, sum, p95 and p99.
Kamari restarts itself if it freezes
- Kamari measures how late its main loop wakes up. Above 500 milliseconds it logs an error.
- If the loop stops for 2 minutes (you can set 10 seconds to 1 hour), Kamari saves what every thread was doing and exits with code 70, so Docker or a service manager can restart it.
By default, records expire after 5 days
- Log lines and audit records older than 5 days are deleted. You can set 1 to 365 days.
- At most 5,000 log lines and 20,000 audit records are kept.
- Both are held in memory unless you turn on saving to disk.